I am continuing to develop a taxonomy to describe the different types of software tools. Rather than waiting until I have a fully fleshed out model, I am sharing my thought process with you in the hopes that it will entice you to share your thoughts and speed up the process of building a workable model.
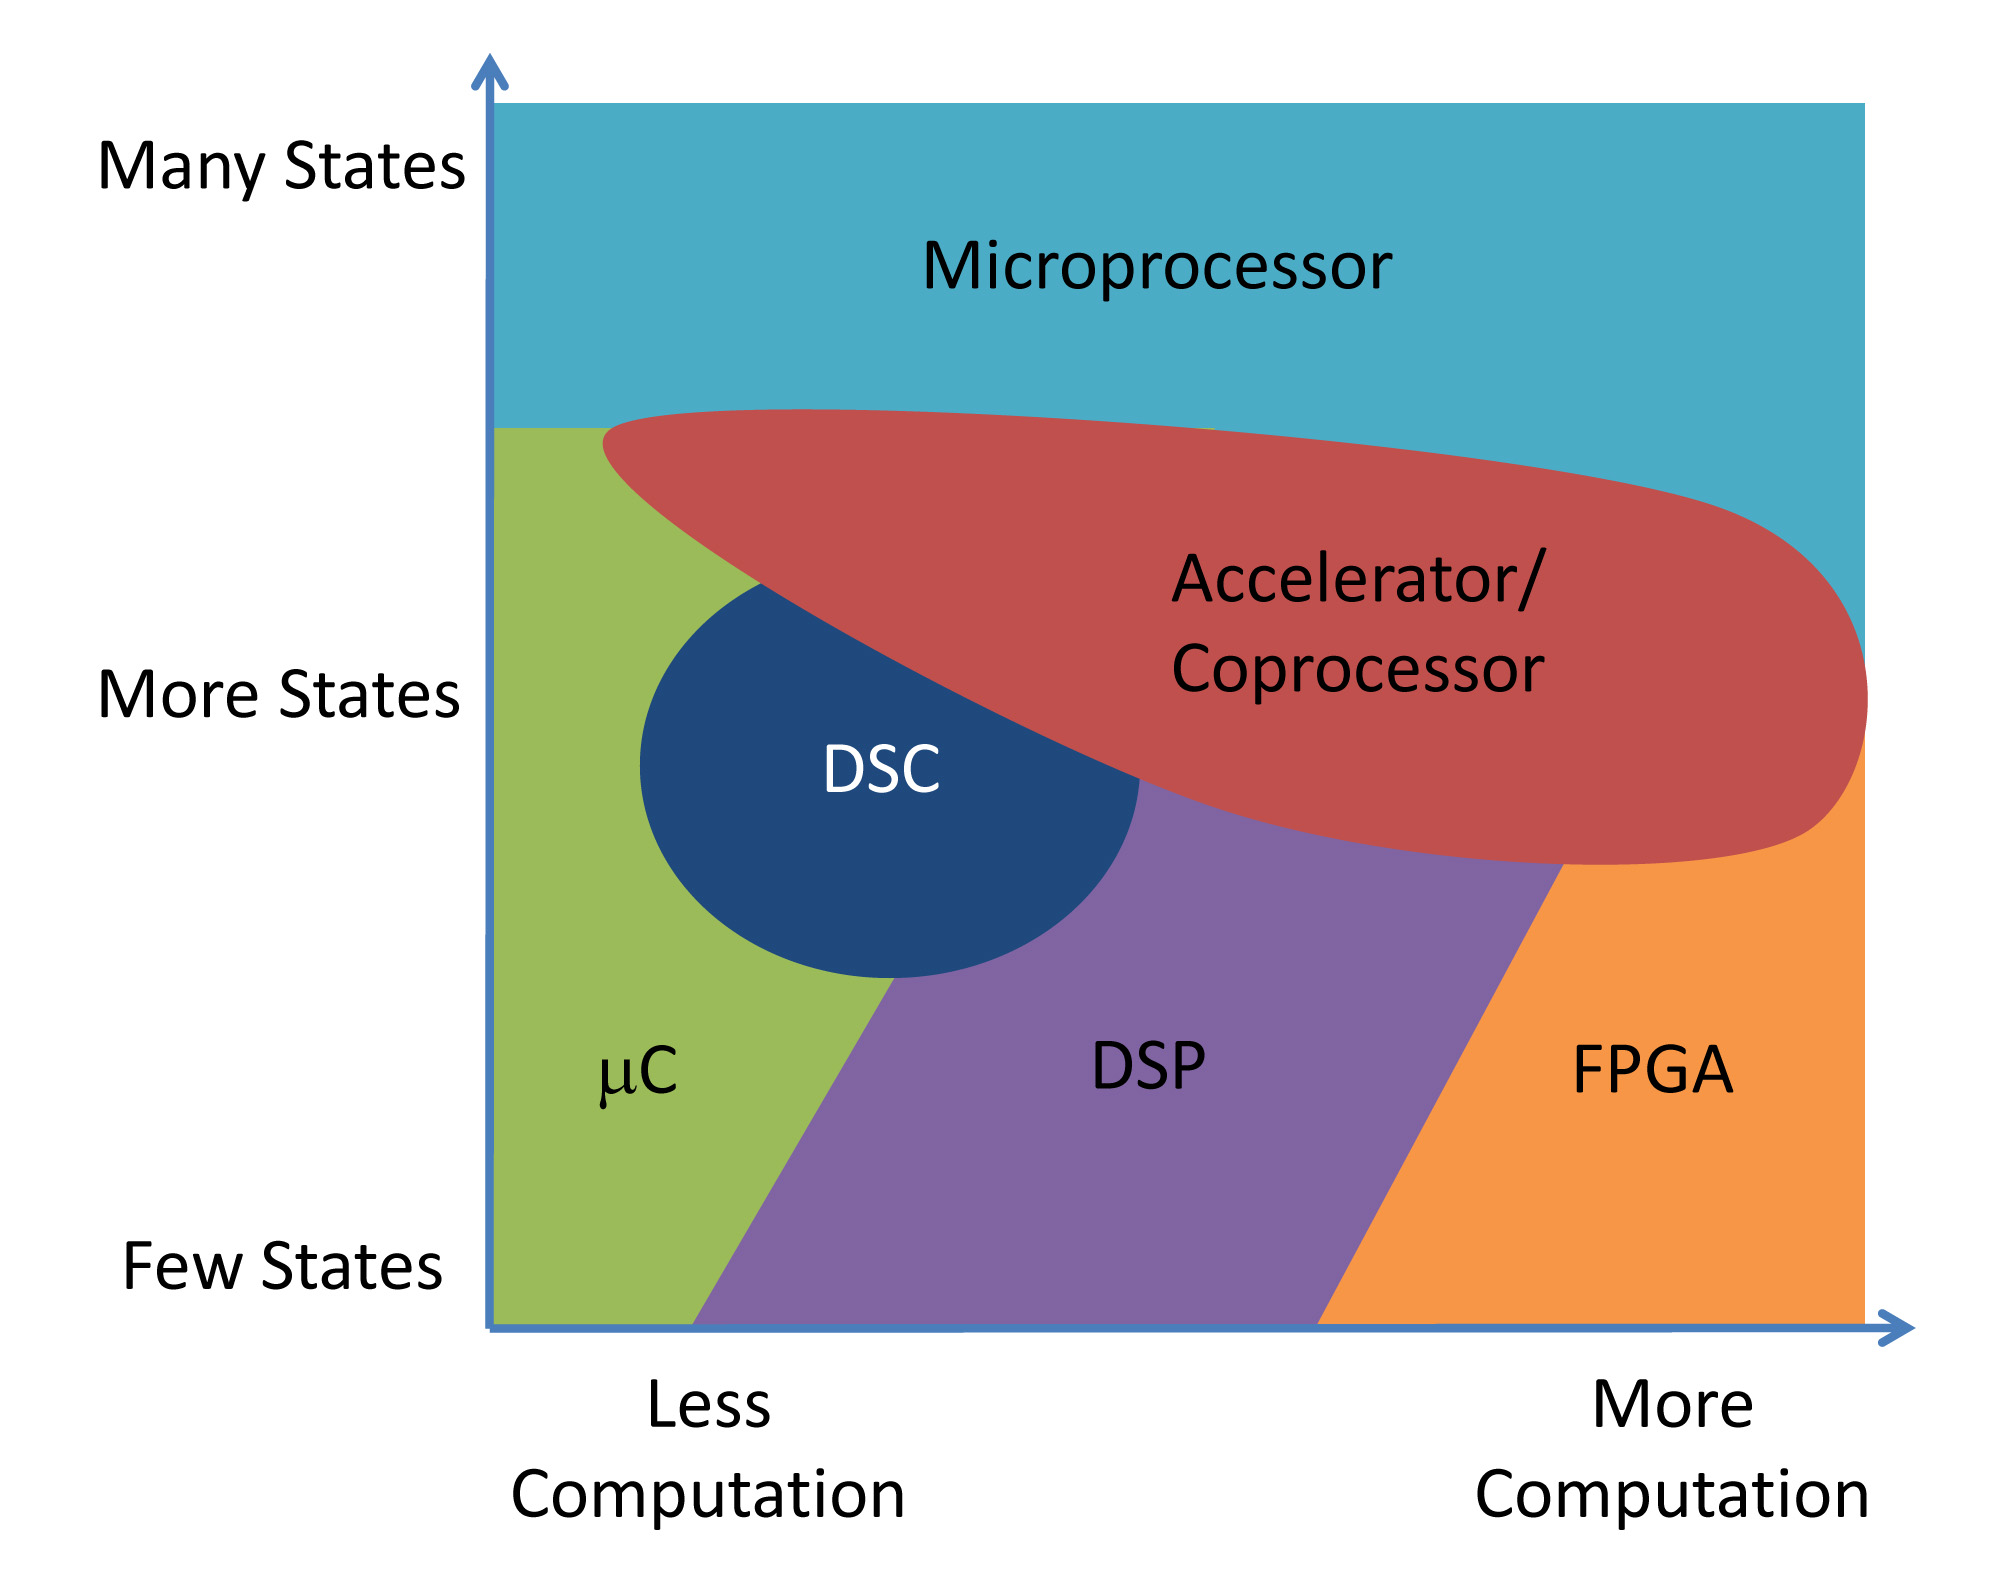
I am offering up the following processing mapping as an example of how an analogous software mapping might look. The mapping identifies two independent characteristics, in this case, the number of states and the amount of computation that the system must handle. One nice thing about mapping the design characteristics like this is that it provides an independence from the target application and allows us to focus on what an architecture is optimizing and why.

For example, a microcontroller’s sweet spot is in the lower end of the computation load but spans from very simple to complicated state machines. Microcontroller architectures emphasize excellent context switching. In contrast, DSP architectures target streaming problems where context switching is less important and maximizing computation for the same amount of time/energy is more important.
I suspect that if we can identify the right characteristics for the axis of the mapping space that software tools will fall into analogous categories of assumptions and optimizations. The largest challenge at this moment is identifying the axes. Candidate characteristics include measures of productivity, efficiency, reusability, abstraction, coupling, and latency tolerance.
An important realization is that the best any software can accomplish is to not stall the hardware processing engine. The software will perform data manipulations and operations that cause the processing engine to stall, or be idle, some percentage of the time. As a result, all software tools are productivity tools that strive to help the developer produce software that is efficient enough to meet the performance, schedule, and budget requirements of the project. This includes operating systems, which provide a layer of abstraction from the underlying hardware implementation.
I propose using a measure of robustness or system resilience and a measure of component coupling as the two axes to map software development tools to a set of assumptions and optimization goals.
The range for the component coupling axis starts at microcode and moves toward higher levels of abstraction such as machine code, assembly code, BIOS, drivers, libraries, operating systems, and virtual machines. Many embedded software developers must be aware of multiple levels of the system in order to extract the required efficiency from the system. As a result, many software tools also target one or more of these layers of abstraction. The more abstraction layers that a tool accommodates, the more difficult it is to build and support.
Consider that while a compiler ideally allows a developer to work at a functional and/or data flow level, it must also be able to provide the developer visibility into the lower level details in case the generated code performs in an unexpected fashion that varies with the hardware implementation. The compiler may include an inline assembler and support #pragma statements that enable the developer to better specify how the compiler can use special resources in the target system.
The robustness axis is harder to define at this moment. The range for the robustness axis should capture the system’s tolerance to errors, inconsistent results, latency, and determinism. My expectation for this axis is to capture the trade-offs that allow the tool to improve the developer’s productivity while still producing results that are “good enough.” I hope to be able to better define this axis in the next write-up.
Do you have any thoughts on these two axes? What other axes should we consider? The chart can go beyond a simple 2D mapping.
Tags: Sweet Spots, Taxonomy