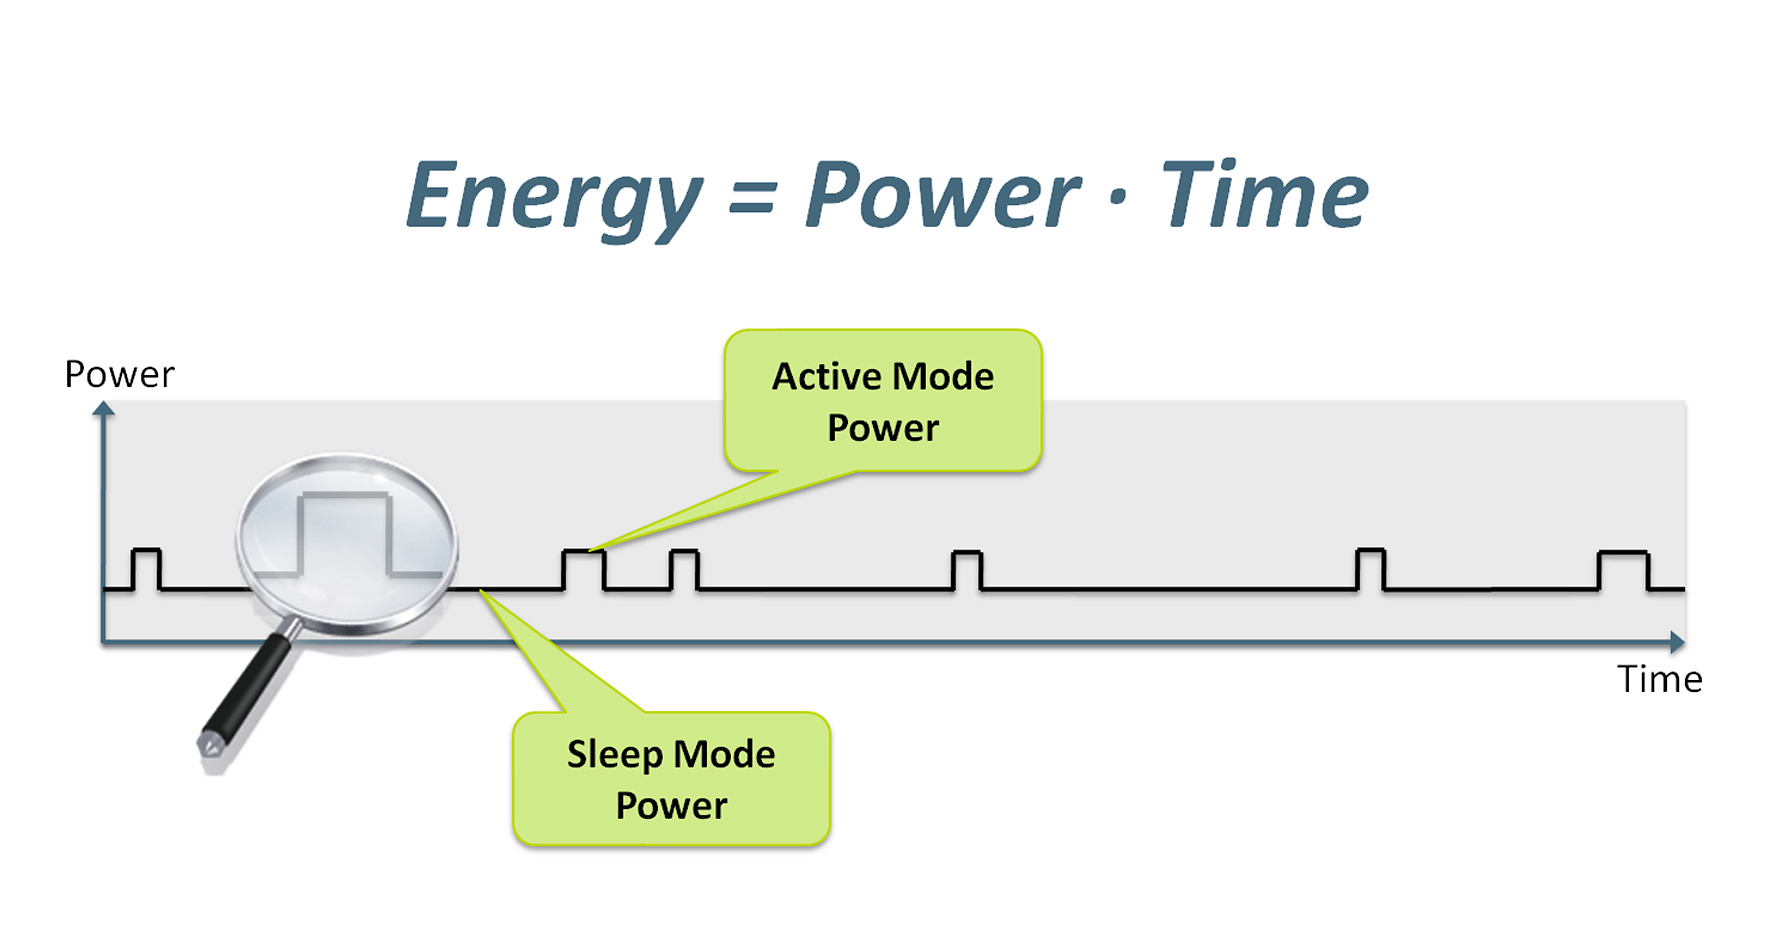
Using an ultra low power microcontroller alas does not by itself mean that an embedded system designer will automatically arrive at the lowest possible energy consumption. To achieve this, the important role of software also needs to be taken into account. Code needs to be optimized, not just in terms of functionality but also with respect to energy efficiency. Software has perhaps never really been formally identified as an ‘energy drain’ and it needs to be. Every clock cycle and line of code consumes energy and this needs to be minimized if best possible energy efficiency is to be achieved.
While the first two parts of this article have proposed the fundamental ways in which microcontroller design needs to evolve in the pursuit of real energy efficiency, so this third part considers how the tools which support them also need to change. Having tools available that provide developers with detailed monitoring of their embedded systems’ energy consumption is becoming vital for many existing and emerging energy sensitive battery-backed applications.
As a development process proceeds, code size naturally increases and optimizing it for energy efficiency becomes a much harder and time-consuming task. Without proper tools, identifying a basic code error such as a while loop that should have been replaced with an interrupt service routine can be difficult. Such a simple code oversight causes a processor to stay active waiting for an event instead of entering an energy saving sleep mode – it therefore matters! If these ‘energy bugs’ are not identified and corrected during the development phase then they’re virtually impossible to detect in field or burn-in tests. Add together a good collection of such bugs and they will have an impact on total battery lifetime, perhaps critically so.
In estimating potential battery lifetimes, embedded developers have been able to use spreadsheets provided by microcontroller vendors to get a reasonable estimation of application behavior in terms of current consumption. Measurements of a hardware setup made by an oscilloscope or multimeter and entered into spreadsheets can be extrapolated to give a pretty close estimation of battery life expectancy. This approach however does not provide any correlation between current consumption and code and the impact of any bugs – the application’s milliamp rating is OK, but what’s not known is whether it could be any better.
With a logic analyzer a developer gets greater access to the behavior of the application and begins to recognize that ‘something strange’ is going on. Yes it’s a ‘code view’ tool, and shows data as timing diagrams, protocol decodes, state machine traces, assembly language or its correlation with source level software, however it offers no direct relationship with energy usage.
Combine the logic analyzer, the multimeter, and the spreadsheet and you do start to make a decent connection between energy usage and code, but the time and effort spent in setting up all the test equipment (and possibly repeating it identically on numerous occasions), making the measurements and recording them into spreadsheets can be prohibitive if not practically impossible.
Low power processors such as the ARM Cortex-M3 however are already providing a SWO (serial wire output) that can be used to provide quite sophisticated and flexible debug and monitoring capabilities that tool suppliers can harness to enable embedded developers to directly correlate code execution with energy usage.
Simple development platforms can be created which permanently sample microcontroller power rail current consumption, convert it, and send it along with voltage and timing data via USB to a PC-based energy-to-code profiling tool. Courtesy of the ARM’s SWO pin, the tool can also retrieve program counter information from the CPU. The coming together of these two streams of data enables true ‘energy debugging’ to take place.
Provided that current measurements have a fairly high dynamic range, say from 0.1µA to 100mA, then it’s possible to monitor a very wide and practical range of microcontroller current consumption. Once uploaded with the microcontroller object code, the energy profiling tool then has all the information resources it needs to accurately correlate energy consumption with code.

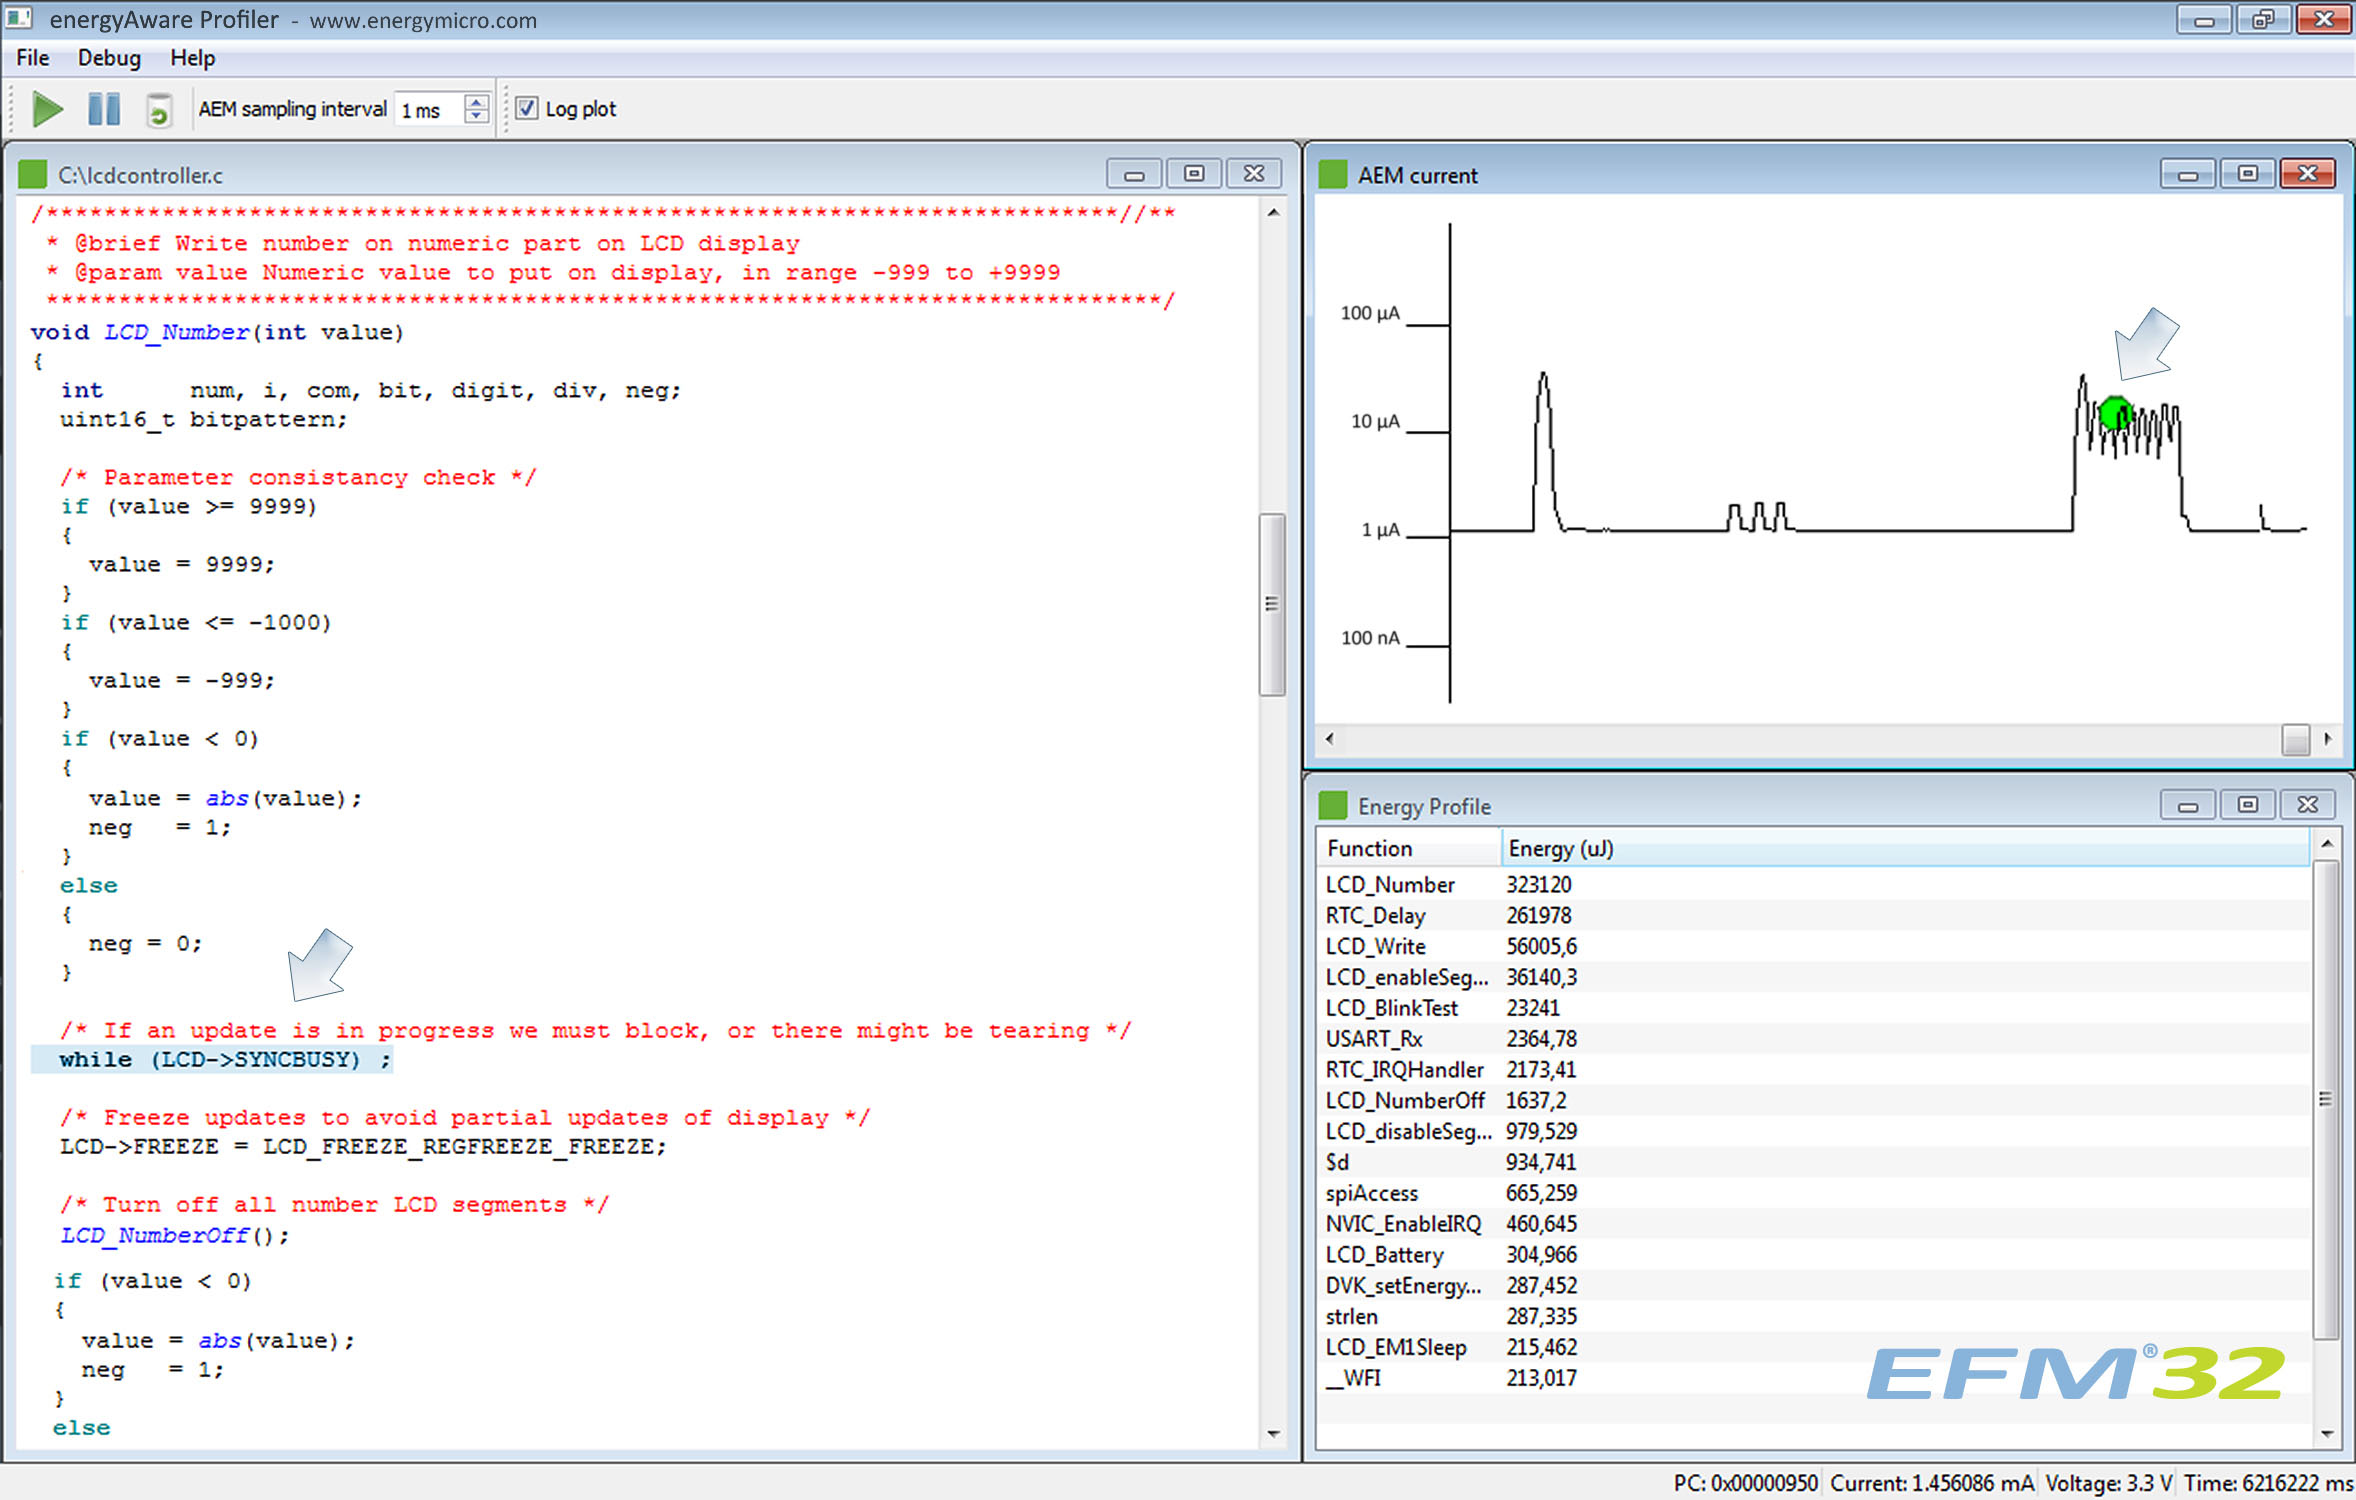
The energyAware Profiler tool from Energy Micro shows the relationship between current consumption, C/C++ code, and the energy used by a particular function. Clicking on a current peak, top right, reveals the associated code, bottom left.
The tool correlates the program-counter value with machine code, and because it is aware of the functions of the C/C++ source program, it can then readily indicate how energy use changes as various functions run. So the idea of a tool that can highlight to a developer in real time, an energy-hungry code problem comes to fruition. The developer watches a trace of power versus time, identifies a surprising peak, clicks on it and is immediately shown the offending code.
Such an ability to identify and rectify energy drains in this way and at an early stage of prototype development will certainly help reduce the overall energy consumption of the end product, and it will not add to the development time either, on the contrary.
We would all be wise to consider the debug process of low power embedded systems development as becoming a 3-stage cycle from now on: hardware debugging, software functionality debugging, and software energy debugging.
Microcontroller development tools need to evolve to enable designers to identify wasteful ‘energy bugs’ in software during the development cycle. Discovering energy-inefficient behavior that endanger battery lifetime during a product field trial is after all rather costly and really just a little bit too late!


